Tree Air Filters are Real!

Tree Air Filters are Real!
Did you know that plants and trees filter PM2.5 and PM10 from the air?
If you’re not familiar with particulates and filtration, let me do a short recap: particulate matter (PM) is a big air pollutant in the form of dust, pollen, and most currently, smoke particles. PM is measured in microns, or a millionth of a meter, and higher levels of PM floating around in the air are dangerous for our lungs, hearts, and whole bodies, because the smallest particles can pass through your lungs directly into your blood. PM10 is matter that is 10 microns or smaller in diameter, and PM2.5 is matter that is 2.5 microns or smaller in diameter. The smaller the particulates, the more dangerous it tends to be for us, because in dry conditions small dust can float in the air for a long time and reach down into the deepest parts of our lungs.
The way trees "filter" dust is one reason why air near trees feels cleaner: they intercept particulate matter, which clings to the surface of the leaves, branches and trunk. The EPA has recognized this and even created a map of certain cities and their suburbs to show how much particulates are removed by trees per year, in kg or %. EnviroAtlas is a cool interactive tool which you can use to examine 30 cities in the US and their suburbs, to see where the most (or least) particulates are removed by trees. Other layers available are ozone, nitrogen dioxide, carbon monoxide, and sulfur dioxide. Other tools available in this map include soil drainage and water supply/runoff/etc. It’s a huge database at your fingertips!
To use this map, go to this link. It will offer a tutorial, or you can follow these steps to find PM2.5 and PM10 reduction:
Click on the box that says “Selected Communities: Combined Communities”.
Select a city you’re interested in and the map will zoom to that area. Then close the box.
Click “Pollutant Reduction: Air” in the left-hand column, and a sub-menu will appear. Then select either “Particulate Matter: PM10” and/or “Particulate Matter: PM2.5” and check whether you want to see kg/year or %. Wait for the map to populate with colors.
Once the area has fully populated in color, you can click on an area of the city and the information about that area will appear in another box. Use the left or right arrows in the box to scroll through it. In general, darker blue areas absorb more PM than green or beige areas because they have more trees.
That’s it! You can play around with different “layers” of information and check out some of the other tools, where data exists for the whole US, not just selected cities.
Trees are used in this way to create buffers around reservoirs, to keep dust and leaves from blowing in. (Working Trees for Water Quality) They also can make up hedgerows around fields to prevent weed seeds from blowing in. (A Guide to Hedgerows: Plantings That Enhance Biodiversity, Sustainability and Functionality) They are also used as “shelterbelts” to decrease the speed of wind blowing over dry soil to reduce erosion and even prevent snow drifts. (Why more 'shelterbelts' could prevent dust storms in the future)
Trees are a well-known asset for cities and residential areas because they help reduce air pollution, absorb excess rainwater, reduce erosion and even remediate soil to an extent. Check out our articles “From the Outside In: How to cultivate a healthy yard that will benefit your indoor air!” and “Surround yourself with trees, and your heart will thank you for it!” to find out how to benefit most from trees in your community, whether you are looking for a place to live or have the opportunity to plant some. In addition, https://www.itreetools.org/ has free tools with free online office hours that will help you find the right trees for your yard or community space.

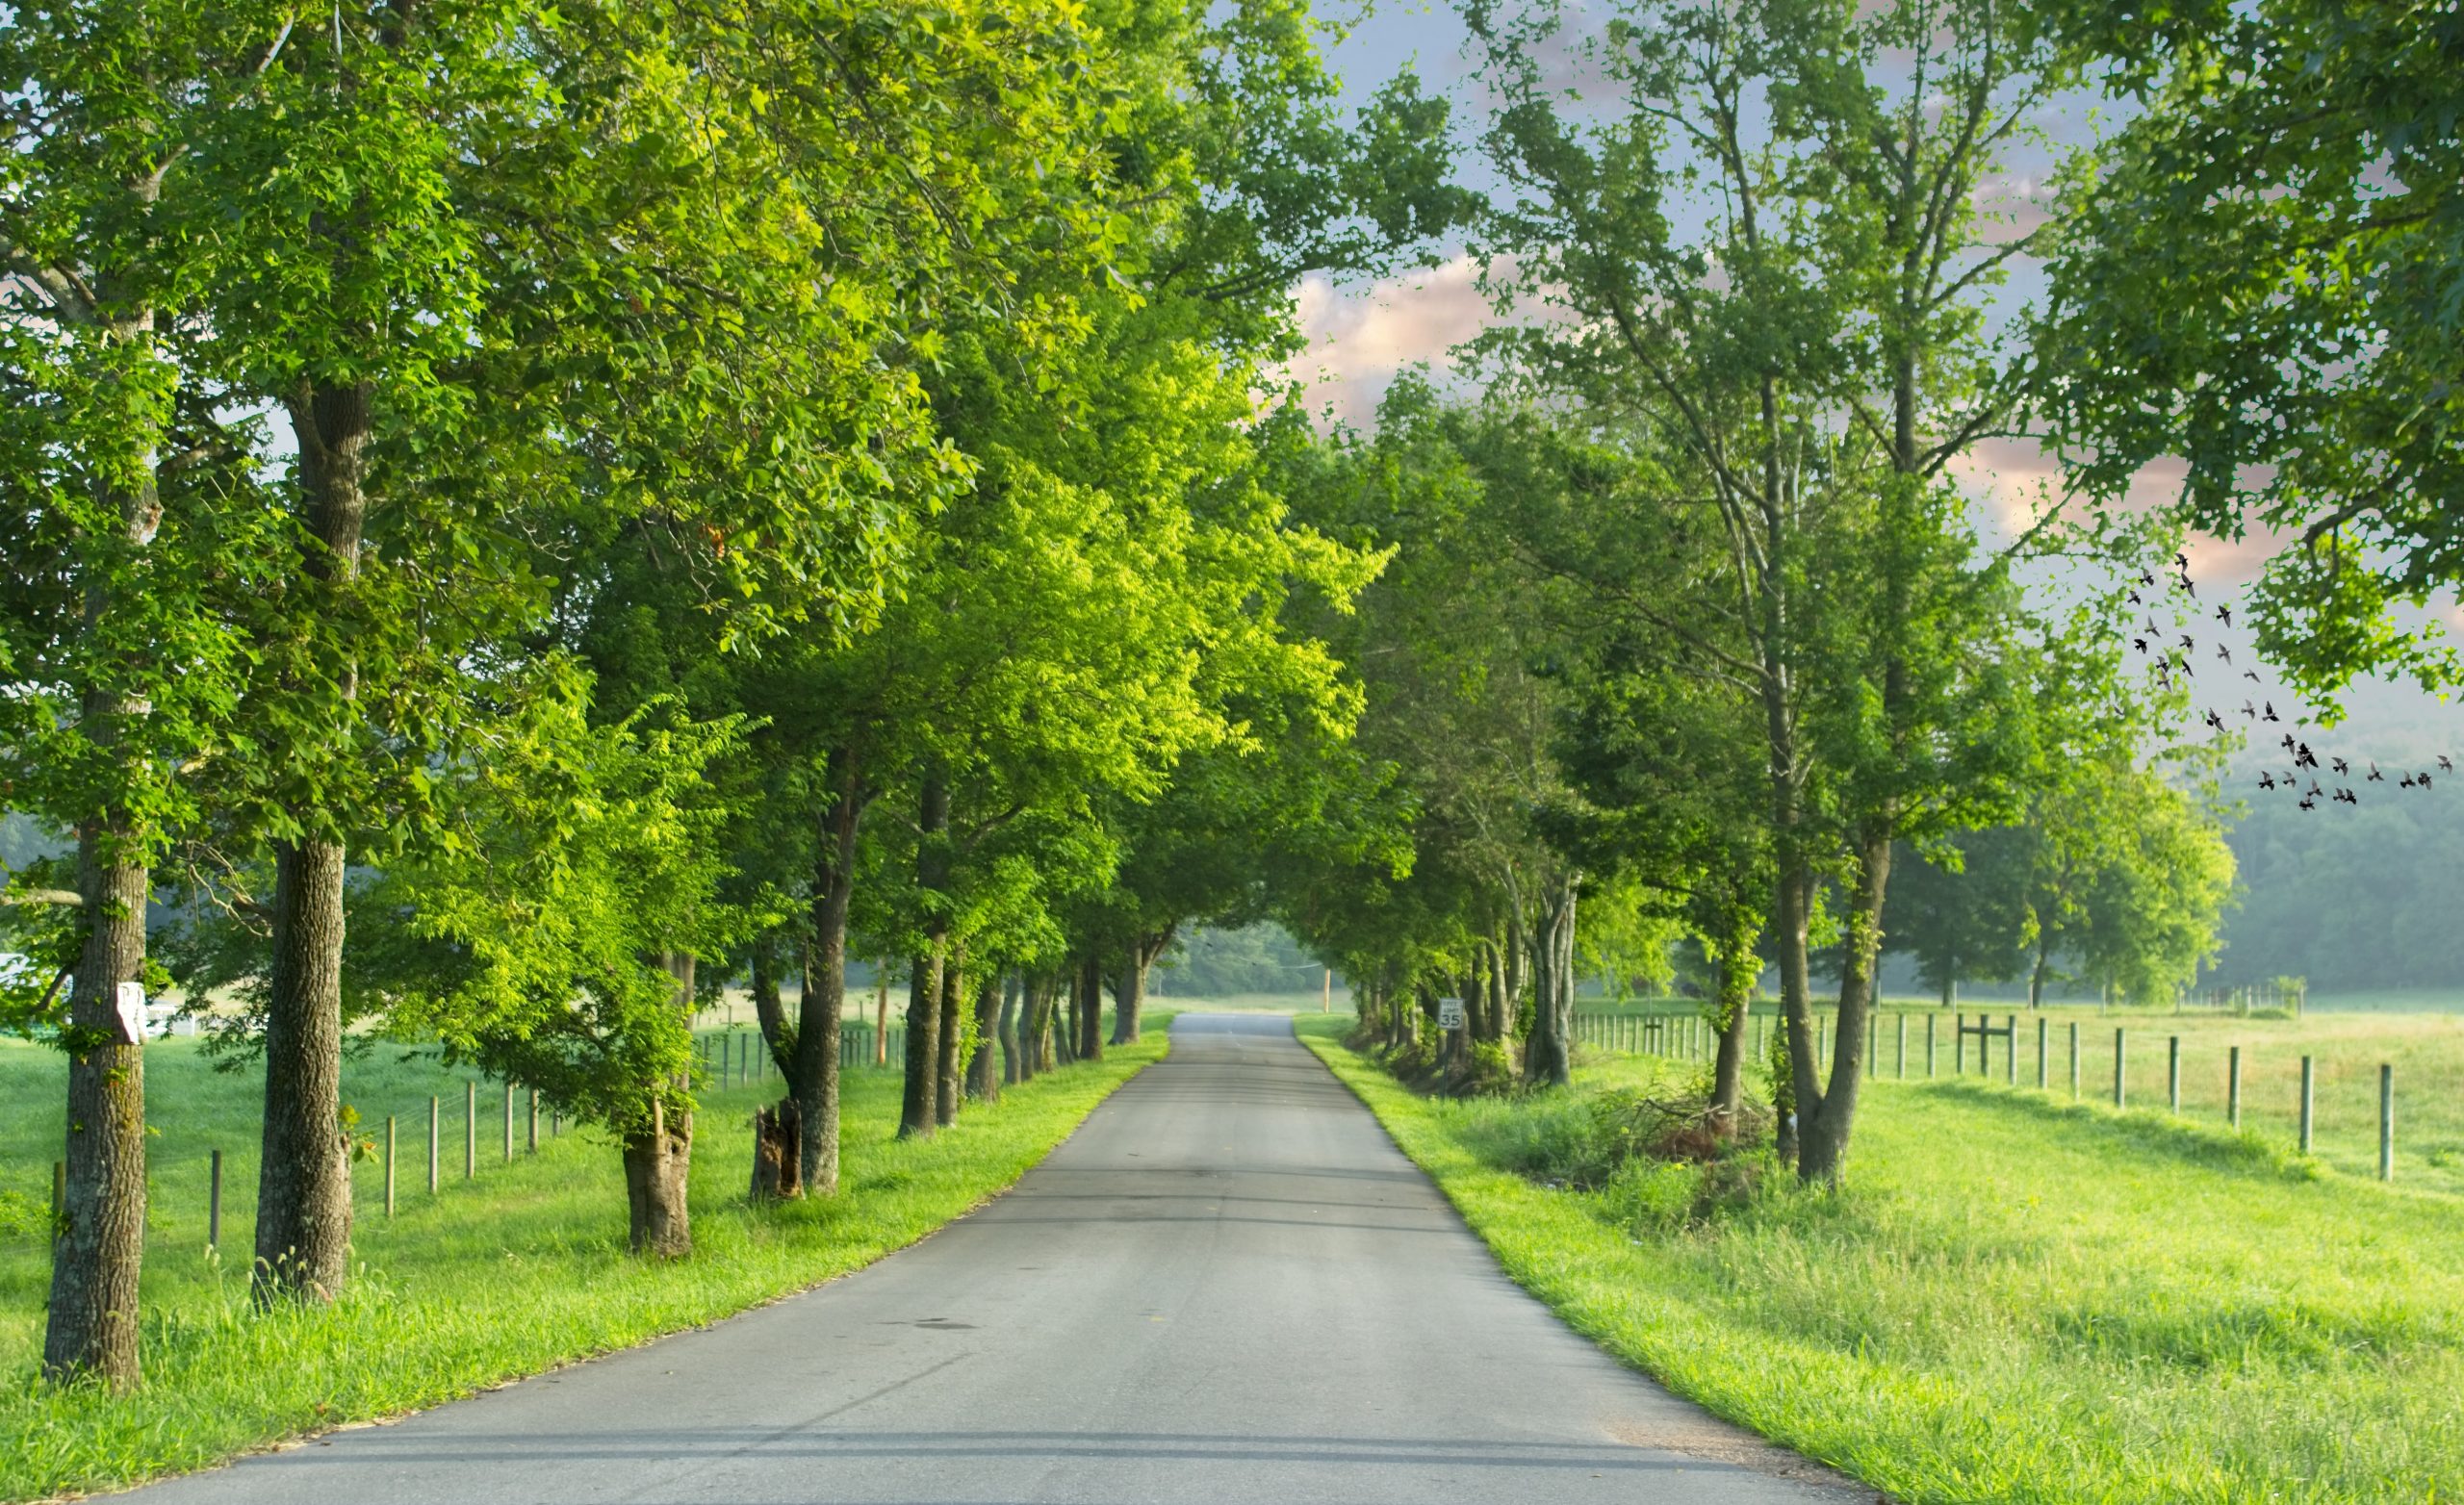
Photo by Alfred Schrock on Unsplash


